
Using Higher Time Frame Support & Resistance (Video)
Cracking Forex's S&R Code
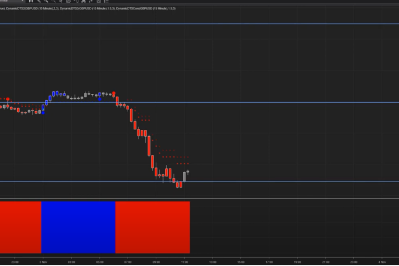
Sometimes when day trading the markets price can stick around a certain point for a long period of time, this can be frustrating and sometimes can lead to traders just getting into a false entry. Whilst the Day Trading Software does a fantastic job in warning you not to enter by coloring the bar gray and also by plotting the resistance with small dots, it can sometimes be helpful to drill down to a smaller time frame to see what is going on.
In the video below you can see me do exactly this and you can see on the 5-minute timeframe we have started a small uptrend but its hitting resistance which has been plotted by the day trading software.
This is what the software is designed to do, it does not just give entries and exits, it shows support and resistance and range bound markets.
Be patient and wait for the system to all line up. This is where consistent profits start.
*This content is developed from sources believed to be providing accurate information. The information provided is not written or intended as tax or legal advice and may not be relied on for purposes of avoiding any Federal tax penalties. Individuals are encouraged to seek advice from their own tax or legal counsel. Individuals involved in the estate planning process should work with an estate planning team, including their own personal legal or tax counsel. Neither the information presented nor any opinion expressed constitutes a representation by us of a specific investment or the purchase or sale of any securities. Asset allocation and diversification do not ensure a profit or protect against loss in declining markets. This material was developed and produced by Advisor Websites to provide information on a topic that may be of interest. Copyright 2021 Advisor Websites.
PHONE
650-240-7260
support@prestigetradingsoftware.com
help@prestigetradingsoftware.com
INDIVIDUAL RISK TOLERANCE, INVESTMENT GOALS AND OTHER FACTORS MAY VARY AMONG SUBSCRIBERS, AND ANY RELIANCE, USE OR TRADING BASED UPON THE INFORMATION OR RECOMMENDATIONS IN THE SOFTWARE MAY NOT BE SUITABLE FOR ALL INDIVIDUALS.
Risk Disclosure
Futures and forex trading contains substantial risk and is not for every investor. An investor could potentially lose all or more than the initial investment. Risk capital is money that can be lost without jeopardizing ones’ financial security or life style. Only risk capital should be used for trading and only those with sufficient risk capital should consider trading. Past performance is not necessarily indicative of future results.
TESTIMONIAL DISCLOSURE:
TESTIMONIALS APPEARING ON www.dynamictradingsoftware.com MAY NOT BE REPRESENTATIVE OF THE EXPERIENCE OF OTHER CLIENTS OR CUSTOMERS AND IS NOT A GUARANTEE OF FUTURE PERFORMANCE OR SUCCESS.
Hypothetical Performance Disclosure:
Hypothetical performance results have many inherent limitations, some of which are described below. No representation is being made that any account will or is likely to achieve profits or losses similar to those shown; in fact, there are frequently sharp differences between hypothetical performance results and the actual results subsequently achieved by any particular trading program. One of the limitations of hypothetical performance results is that they are generally prepared with the benefit of hindsight. In addition, hypothetical trading does not involve financial risk, and no hypothetical trading record can completely account for the impact of financial risk of actual trading. for example, the ability to withstand losses or to adhere to a particular trading program in spite of trading losses are material points which can also adversely affect actual trading results. There are numerous other factors related to the markets in general or to the implementation of any specific trading program which cannot be fully accounted for in the preparation of hypothetical performance results and all which can adversely affect trading results.